
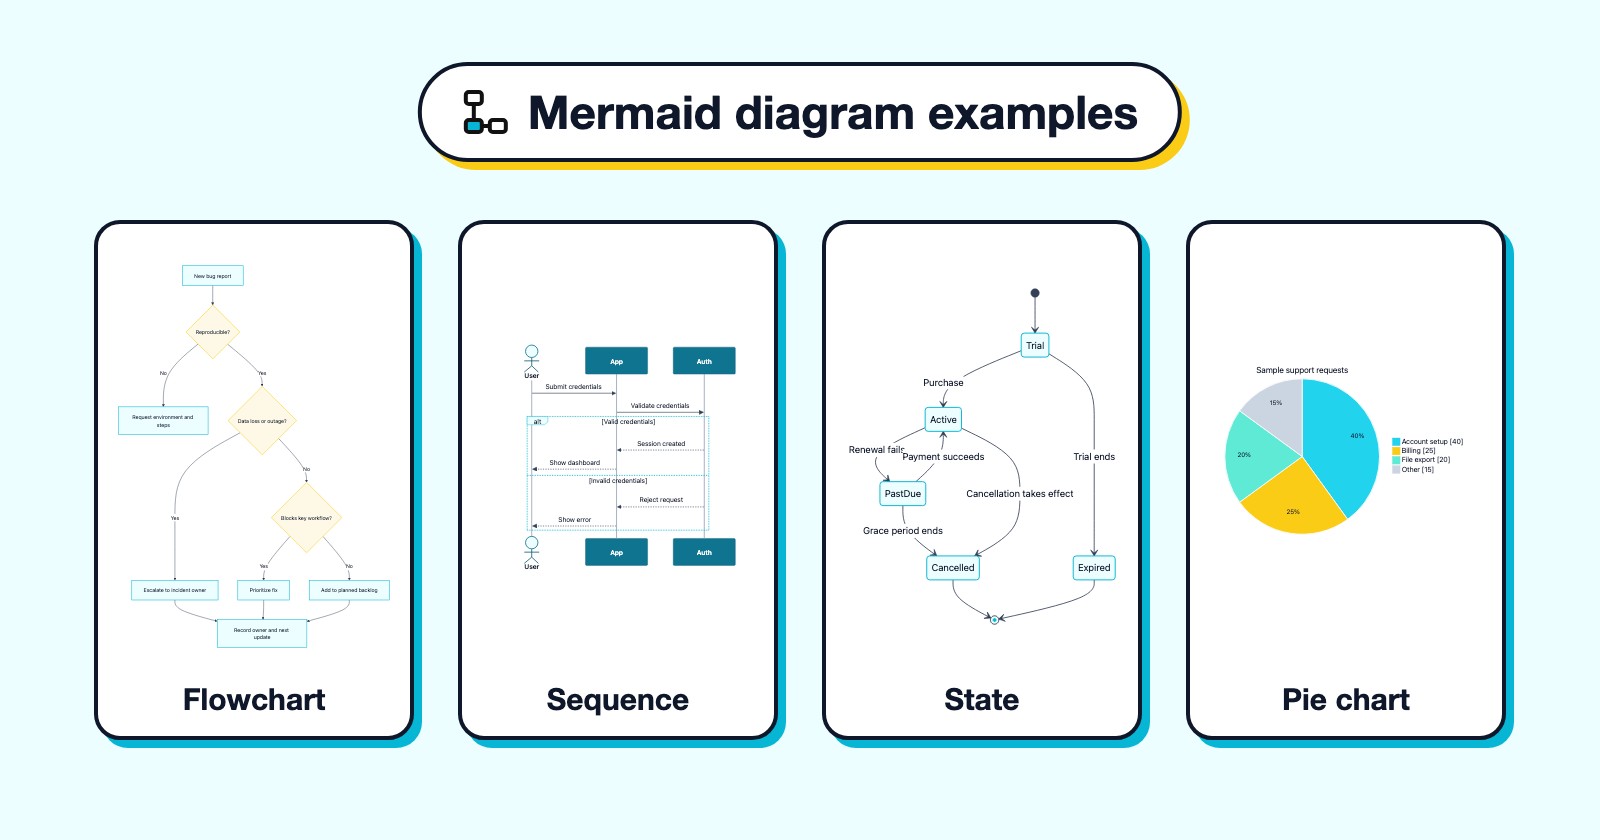
Copy the whole fenced block into a Markdown file. For the Mermaid Live Editor or an .mmd file, copy only the lines between the fences. You can also download all 30 examples as one Markdown file.
The previews use Markdific's colors. The copied code has no color settings, so it takes the default theme of the app that renders it.
Key facts
- A Mermaid diagram in Markdown is a fenced code block that starts with three backticks and the word
mermaid. - The first line inside the block sets the diagram type, for example
flowchart TD,sequenceDiagramorgantt. - This page covers 11 types: flowchart, sequence, state, ER, class, Gantt, mind map, pie, user journey, Git graph and timeline.
- All 30 examples render without errors in Mermaid 11.15.0, the version Markdific bundles, and in the older Mermaid 10.9.6 (checked 29 October 2026).
- GitHub, GitLab, Obsidian and Markdific draw Mermaid blocks in Markdown files. Apps without Mermaid support show the code instead.
- The scenarios, names, dates and numbers are fictional. You can copy, change and reuse the examples, including for commercial work, without attribution.
Choose a Mermaid example
Select an example to jump to it. Select any preview on the page to open the full-size diagram.
| Example | Type | Use it to |
|---|---|---|
| 1. Customer onboarding flow | Flowchart | Map the steps a new customer completes before using a product. |
| 2. Purchase approval workflow | Flowchart | Show how a purchase request moves through review and approval. |
| 3. Bug triage decision tree | Flowchart | Make the first response to a reported bug consistent. |
| 4. Content review and publishing process | Flowchart | Document an editorial workflow with separate writing, review and publishing roles. |
| 5. Continuous integration and release gates | Flowchart | Show what must pass before a software change reaches production. |
| 6. Data processing pipeline | Flowchart | Explain how raw records become a reviewed dataset. |
| 7. Small web application architecture | Flowchart | Introduce the main components of a simple web app. |
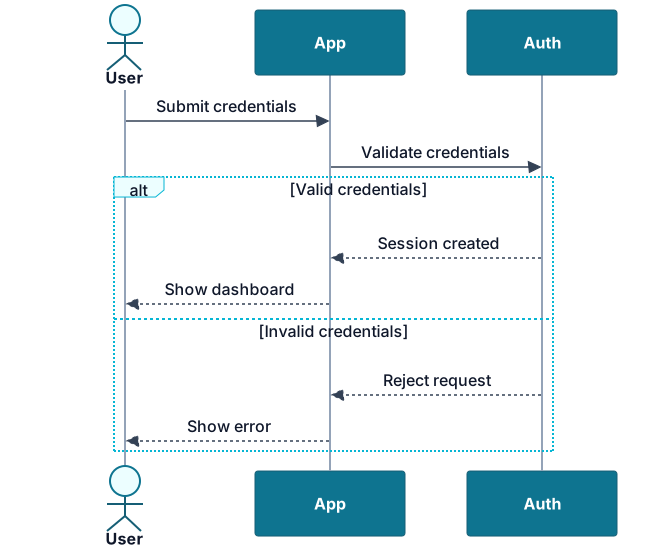
| 8. Login request sequence | Sequence | Explain successful and failed login responses. |
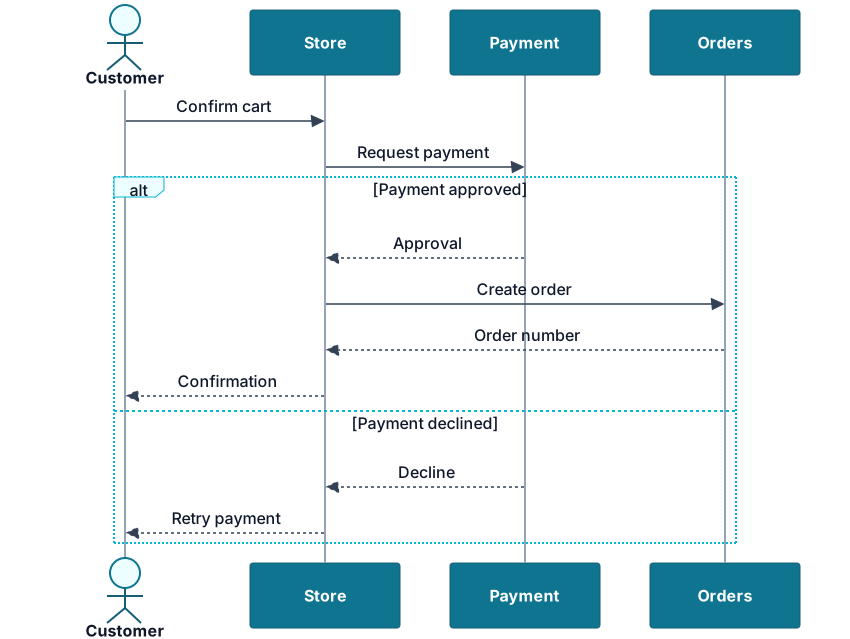
| 9. Checkout and payment confirmation | Sequence | Show the order of checkout messages, including a declined payment. |
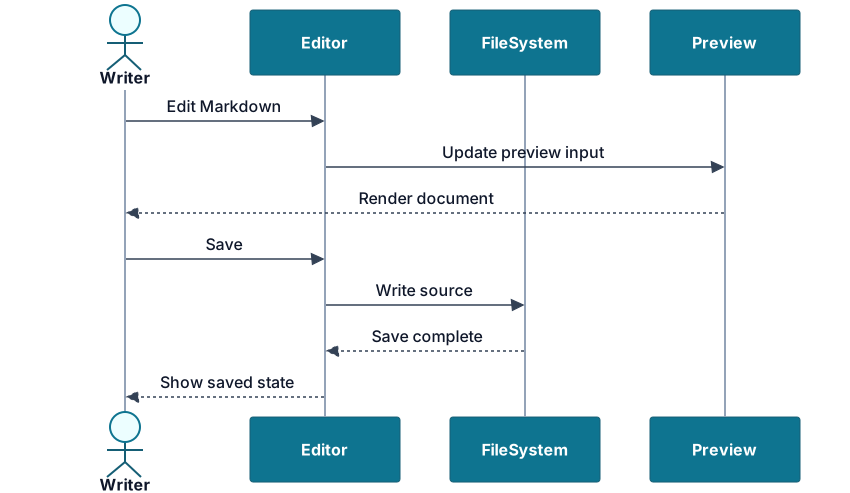
| 10. Document edit, save and preview | Sequence | Explain how editing, saving and previewing a document relate. |
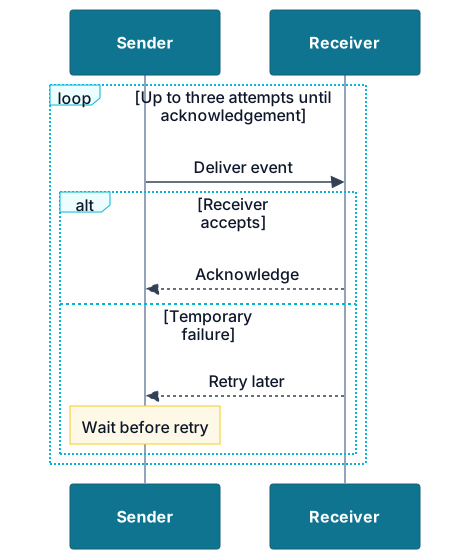
| 11. Webhook delivery attempts | Sequence | Show an acknowledgement and a limited retry loop. |
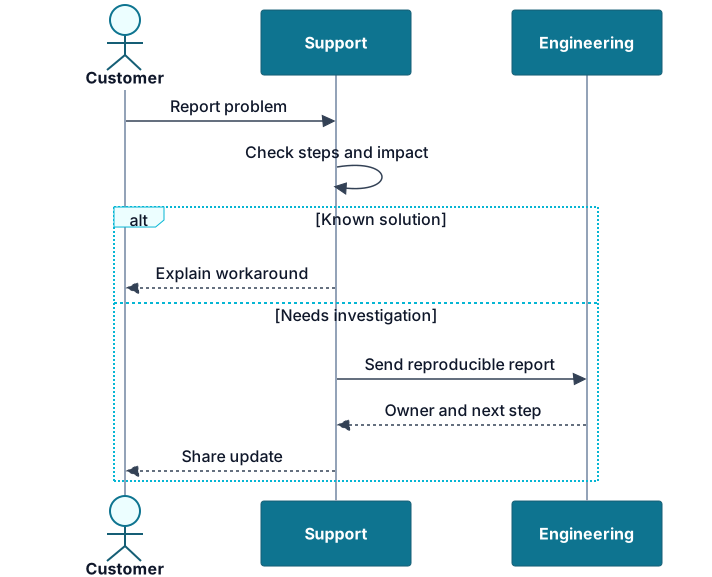
| 12. Support request and engineering handoff | Sequence | Show how a customer question becomes an engineering investigation. |
| 13. Document review states | State | Track the allowed transitions between draft, review and published states. |
| 14. Subscription lifecycle | State | Explain a simple trial and paid subscription model. |
| 15. File upload states | State | Separate uploading, processing, success and failure. |
| 16. Projects and tasks data model | ER | Document how users, projects and tasks relate. |
| 17. Orders, products and line items | ER | Show why orders use separate line items instead of one product field. |
| 18. Research studies and interviews | ER | Organize studies, participants and interview records. |
| 19. Document and exporter classes | Class | Discuss one interface with several export implementations. |
| 20. Notification service interfaces | Class | Separate notification logic from delivery channels. |
| 21. Product pilot schedule | Gantt | Show preparation, pilot sessions and a dated review milestone. |
| 22. Editorial production schedule | Gantt | Plan research, writing and review before a publish date. |
| 23. Website migration plan | Gantt | Show parallel preparation, a cutover and monitoring. |
| 24. Product discovery mind map | Mind map | Organize questions before product research begins. |
| 25. Research report outline | Mind map | Plan a report before writing its sections. |
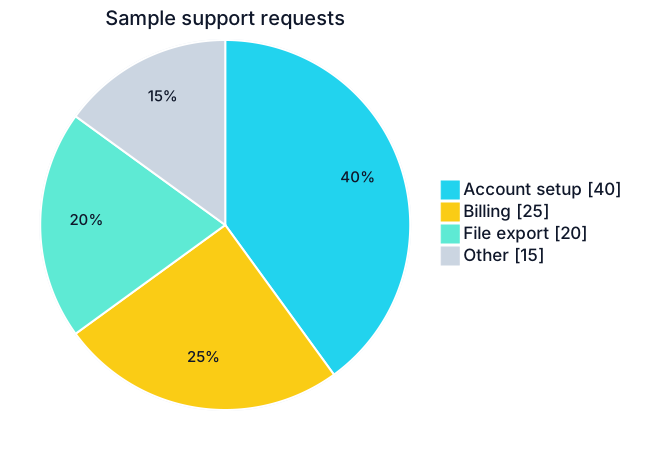
| 26. Support request categories | Pie | Show how a sample of support requests splits by category. |
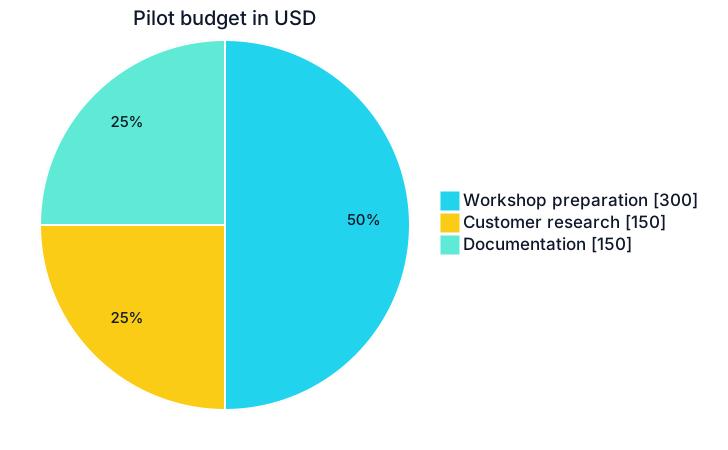
| 27. Project budget allocation | Pie | Summarize how a fixed budget is allocated. |
| 28. Customer onboarding journey | Journey | Show how a customer's experience changes across setup steps. |
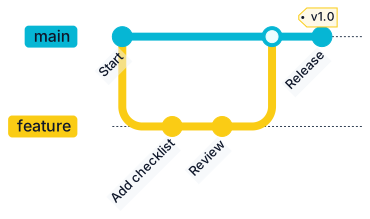
| 29. Feature branch and release merge | Git graph | Explain a feature branch merged into main with a tagged release. |
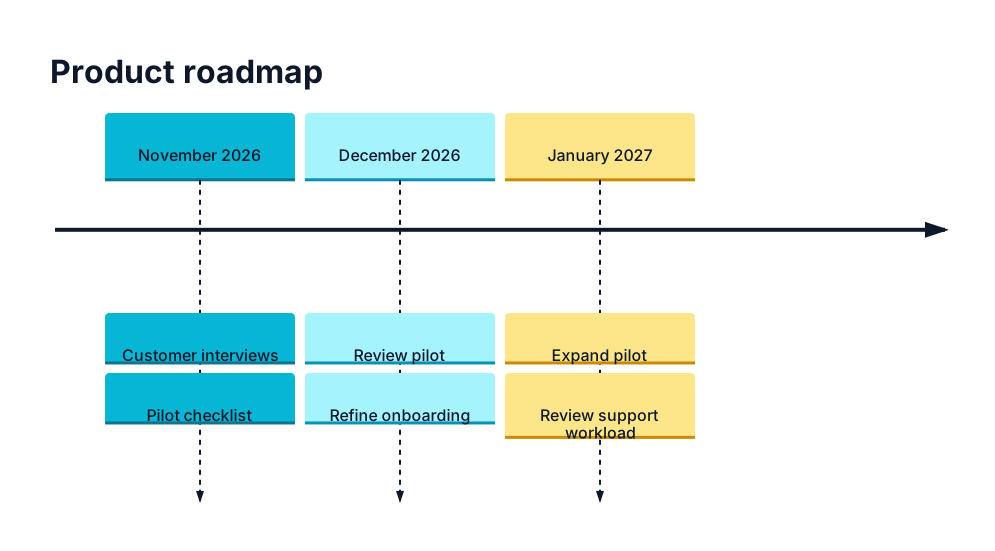
| 30. Product roadmap timeline | Timeline | Communicate planned phases at a high level. |
Mermaid flowchart examples
A flowchart shows steps and decisions. Start with flowchart TD (top down) or flowchart LR (left to right). Square brackets draw a step and curly braces draw a decision.
1. Customer onboarding flow
Use it to: map the steps a new customer completes before using a product.

Markdown source
```mermaid
flowchart LR
    A[Create account] --> B[Verify email]
    B --> C[Create first project]
    C --> D{Setup complete?}
    D -->|Yes| E[Start using product]
    D -->|No| F[Contact support]
    F --> C
```
Customize it: Replace the setup steps and the completion check. Keep the loop back to setup only if customers can return to it.
2. Purchase approval workflow
Use it to: show how a purchase request moves through review and approval.

Markdown source
```mermaid
flowchart TD
    A[Submit purchase request] --> B{Complete information?}
    B -->|No| C[Request details]
    C --> A
    B -->|Yes| D{Above USD 500?}
    D -->|Yes| E[Finance review]
    D -->|No| F[Manager review]
    E --> G{Approved?}
    F --> G
    G -->|Yes| H[Place order]
    G -->|No| I[Record reason]
```
Customize it: Change the threshold, reviewers and revision path to match your purchasing policy.
3. Bug triage decision tree
Use it to: make the first response to a reported bug consistent.

Markdown source
```mermaid
flowchart TD
    A[New bug report] --> B{Reproducible?}
    B -->|No| C[Request environment and steps]
    B -->|Yes| D{Data loss or outage?}
    D -->|Yes| E[Escalate to incident owner]
    D -->|No| F{Blocks key workflow?}
    F -->|Yes| G[Prioritize fix]
    F -->|No| H[Add to planned backlog]
    E --> I[Record owner and next update]
    G --> I
    H --> I
```
Customize it: Replace the impact criteria, owner and queue with your team's rules.
4. Content review and publishing process
Use it to: document an editorial workflow with separate writing, review and publishing roles.

Markdown source
```mermaid
flowchart LR
    subgraph Author[Author]
        A[Draft article] --> B[Check examples and sources]
        C[Revise draft]
    end
    subgraph Reviewer[Reviewer]
        D[Review content] --> E{Ready?}
    end
    subgraph Publisher[Publisher]
        F[Publish] --> G[Check live page]
    end
    B --> D
    E -->|No| C
    C --> D
    E -->|Yes| F
```
Customize it: Rename the groups to your roles and change the approval loop. Each subgraph block, closed by end, draws one labeled group.
5. Continuous integration and release gates
Use it to: show what must pass before a software change reaches production.

Markdown source
```mermaid
flowchart LR
    A[Push change] --> B[Build]
    B --> C{Tests pass?}
    C -->|No| D[Fix change]
    D --> A
    C -->|Yes| E[Deploy staging]
    E --> F{Smoke tests pass?}
    F -->|No| D
    F -->|Yes| G[Approve release]
    G --> H[Deploy production]
    H --> I[Monitor]
```
Customize it: Replace the test suite and deployment gates. Add a manual approval step only if your release process has one.
6. Data processing pipeline
Use it to: explain how raw records become a reviewed dataset.

Markdown source
```mermaid
flowchart LR
    A[Collect records] --> B[Validate schema]
    B --> C{Valid record?}
    C -->|No| D[Quarantine record]
    C -->|Yes| E[Normalize fields]
    E --> F[Aggregate metrics]
    F --> G[(Reviewed dataset)]
    D --> H[Review failures]
```
Customize it: Replace the sources, validation rules and destinations. The [( )] shape draws a database cylinder.
7. Small web application architecture
Use it to: introduce the main components of a simple web app.

Markdown source
```mermaid
flowchart LR
    U[User browser] --> W[Web interface]
    W --> A[API service]
    A --> D[(Database)]
    A --> Q[Job queue]
    Q --> J[Background worker]
    J --> D
    J --> E[Email provider]
```
Customize it: Replace the component names and draw only connections that exist. Use a sequence diagram instead when the order of requests matters.
Mermaid sequence diagram examples
A sequence diagram shows messages between participants in time order. It starts with sequenceDiagram.
8. Login request sequence
Use it to: explain successful and failed login responses.
Markdown source
```mermaid
sequenceDiagram
    actor User
    participant App
    participant Auth
    User->>App: Submit credentials
    App->>Auth: Validate credentials
    alt Valid credentials
        Auth-->>App: Session created
        App-->>User: Show dashboard
    else Invalid credentials
        Auth-->>App: Reject request
        App-->>User: Show error
    end
```
Customize it: Replace the participants and messages. actor draws a person, participant draws a box, and alt with else adds alternative branches.
9. Checkout and payment confirmation
Use it to: show the order of checkout messages, including a declined payment.
Markdown source
```mermaid
sequenceDiagram
    actor Customer
    participant Store
    participant Payment
    participant Orders
    Customer->>Store: Confirm cart
    Store->>Payment: Request payment
    alt Payment approved
        Payment-->>Store: Approval
        Store->>Orders: Create order
        Orders-->>Store: Order number
        Store-->>Customer: Confirmation
    else Payment declined
        Payment-->>Store: Decline
        Store-->>Customer: Retry payment
    end
```
Customize it: Replace the services and messages. Solid arrows (->>) are requests and dashed arrows (-->>) are replies.
10. Document edit, save and preview
Use it to: explain how editing, saving and previewing a document relate.
Markdown source
```mermaid
sequenceDiagram
    actor Writer
    participant Editor
    participant FileSystem
    participant Preview
    Writer->>Editor: Edit Markdown
    Editor->>Preview: Update preview input
    Preview-->>Writer: Render document
    Writer->>Editor: Save
    Editor->>FileSystem: Write source
    FileSystem-->>Editor: Save complete
    Editor-->>Writer: Show saved state
```
Customize it: Rename the editor and storage layer. Keep saving the source and drawing the preview as separate steps.
11. Webhook delivery attempts
Use it to: show an acknowledgement and a limited retry loop.
Markdown source
```mermaid
sequenceDiagram
    participant Sender
    participant Receiver
    loop Up to three attempts until acknowledgement
        Sender->>Receiver: Deliver event
        alt Receiver accepts
            Receiver-->>Sender: Acknowledge
        else Temporary failure
            Receiver-->>Sender: Retry later
            Note over Sender: Wait before retry
        end
    end
```
Customize it: Change the retry limit and the responses. A loop block repeats its messages and Note over adds a comment.
12. Support request and engineering handoff
Use it to: show how a customer question becomes an engineering investigation.
Markdown source
```mermaid
sequenceDiagram
    actor Customer
    participant Support
    participant Engineering
    Customer->>Support: Report problem
    Support->>Support: Check steps and impact
    alt Known solution
        Support-->>Customer: Explain workaround
    else Needs investigation
        Support->>Engineering: Send reproducible report
        Engineering-->>Support: Owner and next step
        Support-->>Customer: Share update
    end
```
Customize it: Change the triage branch and replies. A message from a participant to itself (Support->>Support) shows internal work.
Mermaid state diagram examples
A state diagram shows the conditions something can be in and the events that move it between them. It starts with stateDiagram-v2, and [*] marks the start and end.
13. Document review states
Use it to: track the allowed transitions between draft, review and published states.

Markdown source
```mermaid
stateDiagram-v2
    [*] --> Draft
    Draft --> InReview: Submit
    InReview --> Draft: Request changes
    InReview --> Approved: Approve
    Approved --> Published: Publish
    Published --> Archived: Retire
    Archived --> [*]
```
Customize it: Rename the states and events. Add a withdrawal transition (for example InReview --> Draft: Withdraw) only if your process allows it.
14. Subscription lifecycle
Use it to: explain a simple trial and paid subscription model.

Markdown source
```mermaid
stateDiagram-v2
    [*] --> Trial
    Trial --> Active: Purchase
    Trial --> Expired: Trial ends
    Active --> PastDue: Renewal fails
    PastDue --> Active: Payment succeeds
    PastDue --> Cancelled: Grace period ends
    Active --> Cancelled: Cancellation takes effect
    Cancelled --> [*]
    Expired --> [*]
```
Customize it: Change the trial, renewal and cancellation rules to match your product. Model refunds separately.
15. File upload states
Use it to: separate uploading, processing, success and failure.

Markdown source
```mermaid
stateDiagram-v2
    [*] --> Idle
    Idle --> Uploading: Select file
    Uploading --> Processing: Transfer complete
    Uploading --> Failed: Transfer error
    Processing --> Ready: Validation passes
    Processing --> Failed: Validation fails
    Failed --> Uploading: Retry
    Ready --> [*]
```
Customize it: Replace the retry behavior and error states. Add a cancel transition if your interface offers one.
Mermaid ER diagram examples
An entity relationship (ER) diagram shows tables and how their rows relate. It starts with erDiagram, and symbols such as ||--o{ set the cardinality.
16. Projects and tasks data model
Use it to: document how users, projects and tasks relate.

Markdown source
```mermaid
erDiagram
    USER ||--o{ PROJECT : owns
    PROJECT ||--o{ TASK : contains
    USER o|--o{ TASK : assigned
    USER {
        int user_id PK
        string name
    }
    PROJECT {
        int project_id PK
        int owner_id FK
        string title
    }
    TASK {
        int task_id PK
        int project_id FK
        int assignee_id FK
        string status
    }
```
Customize it: Change the entities, keys and cardinalities. Decide whether a task may be unassigned.
Keep in mind: In USER o|--o{ TASK, o| means zero or one user, so a task can be unassigned. o{ means zero or more tasks.
17. Orders, products and line items
Use it to: show why orders use separate line items instead of one product field.

Markdown source
```mermaid
erDiagram
    CUSTOMER ||--o{ CUSTOMER_ORDER : places
    CUSTOMER_ORDER ||--|{ ORDER_ITEM : includes
    PRODUCT ||--o{ ORDER_ITEM : referenced
    CUSTOMER_ORDER {
        int order_id PK
        int customer_id FK
    }
    ORDER_ITEM {
        int item_id PK
        int order_id FK
        int product_id FK
        int quantity
        decimal unit_price
    }
```
Customize it: Replace the identifiers and attributes. Check how deleting a product or changing a price affects past orders.
18. Research studies and interviews
Use it to: organize studies, participants and interview records.

Markdown source
```mermaid
erDiagram
    STUDY ||--o{ INTERVIEW : includes
    PARTICIPANT ||--o{ INTERVIEW : attends
    STUDY {
        int study_id PK
        string topic
    }
    PARTICIPANT {
        int participant_id PK
        string reference_code
    }
    INTERVIEW {
        int interview_id PK
        int study_id FK
        int participant_id FK
        date interview_date
    }
```
Customize it: Change the cardinalities to match how you recruit participants.
Mermaid class diagram examples
A class diagram shows classes, interfaces and the links between them. It starts with classDiagram.
19. Document and exporter classes
Use it to: discuss one interface with several export implementations.

Markdown source
```mermaid
classDiagram
    class Document {
        +String title
        +String source
        +save()
    }
    class Exporter {
        <<interface>>
        +export(Document)
    }
    class PdfExporter
    class HtmlExporter
    Exporter <|.. PdfExporter
    Exporter <|.. HtmlExporter
    Exporter ..> Document : reads
```
Customize it: Rename the classes, methods and dependencies to match your code. <|.. marks an implementation of an interface and ..> marks a dependency.
20. Notification service interfaces
Use it to: separate notification logic from delivery channels.

Markdown source
```mermaid
classDiagram
    class NotificationService {
        +sendMessage()
    }
    class Channel {
        <<interface>>
        +deliver()
    }
    class EmailChannel
    class SmsChannel
    Channel <|.. EmailChannel
    Channel <|.. SmsChannel
    NotificationService --> Channel : uses
```
Customize it: Replace the channels and method signatures. Add error or retry types if your design has them.
Mermaid Gantt chart examples
A Gantt chart shows dated tasks, durations and dependencies. It starts with gantt and needs a dateFormat line.
21. Product pilot schedule
Use it to: show preparation, pilot sessions and a dated review milestone.

Markdown source
```mermaid
gantt
    title Customer onboarding pilot
    dateFormat YYYY-MM-DD
    section Preparation
    Interviews :a1, 2026-11-02, 3d
    Checklist :a2, after a1, 2d
    section Pilot
    Pilot sessions :a3, after a2, 4d
    Review :milestone, 2026-11-11, 0d
```
Customize it: Change the dates, durations and dependencies. Durations count calendar days, including weekends, unless you add an excludes weekends line.
Keep in mind: A task marked milestone with a 0d duration draws a single point instead of a bar.
22. Editorial production schedule
Use it to: plan research, writing and review before a publish date.

Markdown source
```mermaid
gantt
    title Guide publication schedule
    dateFormat YYYY-MM-DD
    section Article
    Research :r, 2026-11-02, 2d
    Draft :d, after r, 3d
    Review :v, after d, 2d
    Publish :milestone, 2026-11-09, 0d
    Live checks :c, 2026-11-09, 1d
```
Customize it: Replace the dates and tasks. Keep live checks as a separate task after the publish date.
Keep in mind: after d starts a task when the task with id d ends, so changing one date moves the tasks that follow it.
23. Website migration plan
Use it to: show parallel preparation, a cutover and monitoring.

Markdown source
```mermaid
gantt
    title Website migration
    dateFormat YYYY-MM-DD
    section Preparation
    Content inventory :a, 2026-11-02, 3d
    Redirect mapping :b, 2026-11-02, 4d
    Staging checks :c, 2026-11-06, 3d
    section Release
    Cutover :milestone, 2026-11-09, 0d
    Monitor and resolve :d, 2026-11-09, 5d
```
Customize it: Change the tasks and dates to match your release plan and rollback steps.
Mermaid mind map examples
A mind map shows a topic hierarchy. It starts with mindmap, and indentation sets the levels.
24. Product discovery mind map
Use it to: organize questions before product research begins.

Markdown source
```mermaid
mindmap
  root((Product discovery))
    Users
      New customers
      Returning customers
    Problems
      Setup confusion
      Missing guidance
    Evidence
      Interviews
      Support tickets
      Product analytics
    Decisions
      Pilot scope
      Success measures
```
Customize it: Replace the branches with your own questions and evidence sources.
Keep in mind: Indentation sets the hierarchy, so keep it consistent and use spaces. ((text)) draws the round root node.
25. Research report outline
Use it to: plan a report before writing its sections.

Markdown source
```mermaid
mindmap
  root((Research report))
    Question
      Scope
      Audience
    Method
      Participants
      Sources
      Limitations
    Findings
      Observations
      Patterns
    Recommendations
      Next steps
      Owners
```
Customize it: Change the branches to fit your research question and audience.
Mermaid pie chart examples
A pie chart shows how a whole splits into parts. It starts with pie.
26. Support request categories
Use it to: show how a sample of support requests splits by category.
Markdown source
```mermaid
pie showData
    title Sample support requests
    "Account setup" : 40
    "Billing" : 25
    "File export" : 20
    "Other" : 15
```
Customize it: Replace the category names and counts, and state the time period in the text around the chart.
Keep in mind: showData prints each value next to its legend label. Mermaid works out the percentages, so the values do not need to total 100.
27. Project budget allocation
Use it to: summarize how a fixed budget is allocated.
Markdown source
```mermaid
pie showData
    title Pilot budget in USD
    "Workshop preparation" : 300
    "Customer research" : 150
    "Documentation" : 150
```
Customize it: Replace the values with the approved budget and keep the currency in the title.
Mermaid user journey example
A user journey scores how a person feels at each step of a task. It starts with journey.
28. Customer onboarding journey
Use it to: show how a customer's experience changes across setup steps.

Markdown source
```mermaid
journey
    title Customer onboarding experience
    section Discover
      Read product page: 4: Customer
      Compare options: 3: Customer
    section Start
      Create account: 4: Customer
      Verify email: 2: Customer
    section Use
      Create first project: 3: Customer
      Receive guidance: 5: Customer, Support
```
Customize it: Replace the actors, steps and scores with your research findings.
Keep in mind: Each task line is Task: score: actors. Scores run from 1 (worst) to 5 (best).
Mermaid Git graph example
A Git graph draws commits, branches and merges in the order you list them. It starts with gitGraph.
29. Feature branch and release merge
Use it to: explain a feature branch merged into main with a tagged release.
Markdown source
```mermaid
gitGraph
    commit id: "Start"
    branch feature
    checkout feature
    commit id: "Add checklist"
    commit id: "Review"
    checkout main
    merge feature
    commit id: "Release" tag: "v1.0"
```
Customize it: Rename the branch, commits and tag to match your team's process.
Keep in mind: Commands run in order: branch creates a branch, checkout switches to it, and merge joins it into the current branch.
Mermaid timeline example
A timeline lists events or phases by period. It starts with timeline.
30. Product roadmap timeline
Use it to: communicate planned phases at a high level.
Markdown source
```mermaid
timeline
    title Product roadmap
    November 2026 : Customer interviews : Pilot checklist
    December 2026 : Review pilot : Refine onboarding
    January 2027 : Expand pilot : Review support workload
```
Customize it: Replace the periods and outcomes. Use a Gantt chart instead when tasks need dates and dependencies.
Adapt an example without breaking it
- Keep the first line (the diagram keyword) and replace the visible labels first.
- Update the relationships, branches and cardinalities to match the real process.
- Replace the fictional dates, amounts and scores with your own values.
- Render the result in the app where people will read it.
- Keep the editable source next to any exported image, so the diagram stays easy to update.
If a flowchart label contains punctuation such as parentheses, put it in quotes:
A["Review cost (USD)"]
In mind maps, keep the indentation consistent. In Gantt charts, check the task dependencies as well as the visible dates.
To give a copied diagram the same colors in any app, add this line above the diagram keyword, inside the fence:
%%{init: {"theme": "base", "themeVariables": {"primaryColor": "#ECFEFF", "primaryBorderColor": "#06B6D4", "primaryTextColor": "#0F172A", "lineColor": "#334155"}}}%%
Use the diagrams in project documents
A diagram should answer one question. Put a one-sentence conclusion beside it, so the document still makes sense where the diagram does not render.
- Put onboarding flows and success measures in a product requirements document.
- Put milestones and owners beside a Gantt chart in a project plan.
- Put service interactions and data models in a technical design document.
- Put the decision and the rejected options in an architecture decision record.
- Link an approval flowchart to its standard operating procedure.
Keep a table next to a pie or Gantt chart when readers need exact values.
Troubleshoot a copied example
You see code instead of a diagram: check that the app supports Mermaid, that the fence is labeled mermaid and that you are in preview or reading mode.
You get a parse error: paste the unchanged example first, then apply your edits one at a time. Look for a missing end, an extra fence or an unquoted label with punctuation.
The layout looks different: fonts, themes and Mermaid versions change spacing and line breaks. The connections should stay the same.
The diagram is missing from an export: check the exported file itself, because export tools can differ from the editor preview. Keep the source available alongside any image you export.
Labels are too small on a phone: select the preview to open the full-size diagram. In your own documents, shorten labels, switch LR to TD or split a large diagram in two.
How these examples were checked
On 29 October 2026 we rendered all 30 examples with Mermaid 11.15.0, the version bundled in Markdific, and with the older Mermaid 10.9.6. All 30 rendered without errors. The previews on this page were drawn with Mermaid 11.15.0 and the base theme set to Markdific's colors.
Layout can still differ slightly between apps because of fonts, themes and the Mermaid version each app uses. For syntax rules and rendering problems, see Mermaid diagrams in Markdown.
Frequently asked questions
How do I add a Mermaid diagram to Markdown?
Put the diagram in a fenced code block and write mermaid right after the opening three backticks. Apps that support Mermaid draw the diagram, and other apps show the code.
How do I make a flowchart in Mermaid?
Start the block with flowchart TD or flowchart LR, then write one connection per line, such as A[Start] --> B{Done?}. Square brackets draw a box, curly braces draw a decision and -->|Yes| labels an arrow.
Does GitHub support Mermaid diagrams?
Yes. GitHub draws Mermaid blocks in Markdown files, issues, pull requests, discussions and wikis. We did not test each example on GitHub, but all 30 render without errors in Mermaid 11.15.0 and in the older 10.9.6.
Which version of Mermaid does GitHub use?
Check it on GitHub itself: put the single word info inside a mermaid block, and GitHub renders the version number instead of a diagram. The steps are in GitHub's diagram documentation.
Which apps show Mermaid diagrams in Markdown files?
Markdific, GitHub, GitLab and Obsidian draw Mermaid blocks in Markdown files, and apps without Mermaid support show the code. All 30 examples here render with the Mermaid version Markdific bundles (11.15.0); the examples pack puts them in one file.
Can I edit a Mermaid diagram with a live preview?
Yes. The Mermaid Live Editor redraws the diagram as you type; paste only the lines inside the fence, then copy the result back into your Markdown file. A Markdown editor with a preview, such as Markdific in split view, shows the diagram next to the source while you edit.
What is an .mmd file?
An .mmd file is a plain text file that holds only Mermaid source, with no Markdown fences around it. Every example on this page has a downloadable .mmd file as well as the fenced Markdown block.
Is a timeline the same as a Gantt chart?
No. A timeline lists phases or events by period, while a Gantt chart shows task durations and dependencies on a dated axis.
Syntax references
The examples are original scenarios. The syntax follows the Mermaid documentation for flowcharts, sequence diagrams, state diagrams, ER diagrams, class diagrams, Gantt charts, mind maps, pie charts, user journeys, Git graphs and timelines.
To read and edit Markdown files like these as formatted documents, open them in Markdific, a Markdown viewer and editor for Mac, Windows and Linux.
Related pages
- Mermaid diagrams in Markdown
- Markdown on GitHub
- Markdown in Obsidian
- Markdown to PDF converter
- Markdown templates